


When India gained independence in 1947, 1 British pound was worth 13.33 Indian rupees and the rupee was still pegged to the pound. Seventy-nine years later, 1 GBP fetches roughly 127 INR. The journey from 13 to 127 maps onto every major economic shock of the post-Independence era, from the 1949 sterling devaluation to the 1991 balance of payments crisis and the long drift of recent decades.
In 1947, 1 GBP was 13.33 INR with the rupee pegged to the pound. After devaluations in 1949, 1966, and 1991, plus the move to a market-determined rate in 1993, the GBP-INR rate climbed steadily. In July 2026, 1 GBP is approximately 127 INR.
This article walks through the GBP to INR rate from 1947 to today, the major policy events that shaped the pair, and what travellers and students heading to the UK should know about the rate before booking forex.
The GBP to INR Historical Timeline
1947-1949: The Sterling Peg
At independence, India was part of the Sterling Area, with the rupee pegged to the pound at 1 GBP = 13.33 INR. The pound itself was worth USD 4.03 at the time, meaning the rupee was around USD 0.30 or roughly 1 USD = 3.30 INR. The sterling peg shaped both India’s reserves policy and its trade flows for the next two decades.
1949: The Sterling Devaluation
In September 1949, the UK devalued the pound by 30.5 percent against the dollar, from USD 4.03 to USD 2.80. India followed the rupee in step. The GBP-INR rate stayed broadly stable at around 13.33 because both currencies devalued together. The USD-INR rate, however, moved from 3.30 to 4.76.
1966: The Circumstantial Devaluation
After successive droughts, the 1965 war with Pakistan, and pressure from the World Bank, India devalued the rupee by 36.5 percent in June 1966. The GBP-INR rate jumped from 13.33 to approximately 21 INR. The UK then devalued its own currency in 1967 by 14 percent, which brought GBP-INR back down to around 18 INR by the late 1960s.
1971-1991: The Basket Peg Era
After the Bretton Woods system collapsed in 1971, the rupee was eventually pegged to a basket of currencies in 1975. Through the 1980s, the GBP-INR rate drifted between 18 and 30 as the pound itself fluctuated against the dollar and the rupee slowly weakened. By 1990, 1 GBP was around 30 INR.
1991: Crisis and Liberalisation
The 1991 balance of payments crisis forced two devaluations within three days in July 1991. The GBP-INR rate jumped from approximately 33 INR into the low 40s. This crisis triggered the broader economic liberalisation that reshaped India’s foreign exchange regime.
1993: The Market-Determined Rate Begins
In March 1993, India moved to a unified market-determined exchange rate. The rupee began trading freely against major currencies. By 1995, 1 GBP was around 50 INR. By 2000, it had climbed to 68 INR.
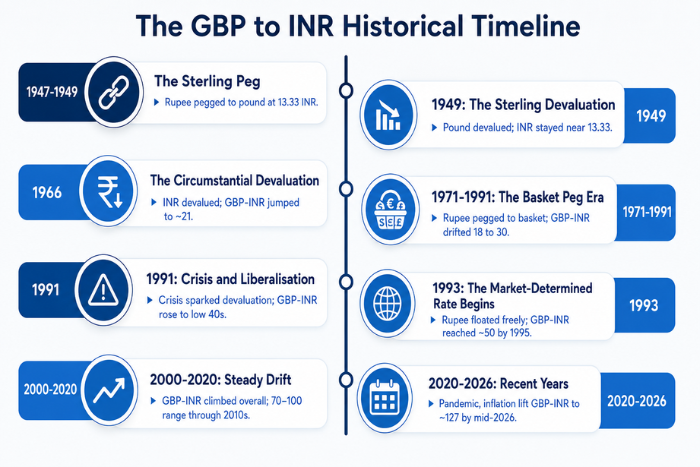
2000-2020: Steady Drift
Through the 2000s, the GBP-INR rate climbed in steps. By 2007, before the global financial crisis, 1 GBP touched 82 INR. The crisis pushed the pound down globally, and GBP-INR fell back to around 70 INR by 2010.
From 2011 to 2016, the rate climbed back into the 90 to 100 INR range. Post-Brexit, the pound weakened sharply, but rupee weakness compensated, keeping GBP-INR in the 80 to 95 INR band through 2017 to 2020.
2020-2026: Recent Years
The pandemic, persistent UK inflation, and the rupee’s own decline against the dollar drove GBP-INR higher. By early 2024, 1 GBP was around 105 INR. Through 2025, the rate climbed to 121 INR by year-end, and by mid-2026 it stands at approximately 127 INR.
Summary Table of the GBP-INR Price Movement
| Year | GBP to INR |
|---|---|
| 1947 | ₹13.33 |
| 1966 | Approx ₹21 |
| 1975 | ₹18.34 |
| 1990 | ₹30.59 |
| 1991 | ₹43.61 |
| 2000 | ₹67.74 |
| 2010 | ₹69.43 |
| 2020 | ₹93.66 |
| 2024 | ₹105.38 |
| 2026 | ₹127.03 |
The pound has multiplied roughly 9.5 times against the rupee since Independence, with most of the gain concentrated in the post-1991 liberalisation era.
What Drives the GBP-INR Rate
1. UK monetary policy
Bank of England rate decisions move the pound against major currencies, which feeds directly into GBP-INR.
2. Indian inflation and trade deficit
Persistent inflation differentials and a wide trade deficit have been the steady drag on the rupee for two decades.
3. Capital flows
Foreign portfolio investment into and out of Indian markets affects rupee demand. Heavy outflows in 2025 and early 2026 contributed to recent rupee weakness.
Why the GBP Matters for Indians
Several Indian students prefer UK universities, making the UK one of the top three destinations for Indian higher education. Tuition fees at UK universities range from GBP 15,000 to GBP 40,000 per year, with living costs adding another GBP 12,000 to GBP 18,000.
Indian-origin residents in the UK exceed 1.8 million. Indian travellers remained a major and growing source market in 2024. Combined remittance corridors from the UK to India total roughly USD 12 to 13 billion annually, making the UK the third-largest source of remittances to India after the US and UAE. Every GBP-INR move directly affects student affordability, tourism budgets, and family remittance values across hundreds of thousands of households.
Tracking the GBP-INR Rate
For travellers, students, and remitters watching the pound, the live GBP to INR rates on BookMyForex update through the trading day at interbank reference levels. The same page shows recent movement, which helps with timing a UK trip booking or a tuition transfer to a British university.
Airport counters and credit cards add 3 to 10 percent above the live interbank rate. Booking GBP through an authorised dealer at the live rate eliminates that spread, and locking the rate in early is the simplest hedge against further drift.
From ₹13.33 in 1947 to ₹127 in 2026, the GBP-INR pair tells the story of the rupee’s long journey. For travellers and students heading to the UK, tracking the rate and booking early are the simplest defences against further drift.
About the Author

Kshitij Pandey is the Content Manager at BookMyForex with over 7 years of experience in content marketing, blogging, and social media strategy. He has worked extensively on building engaging campaigns and informative resources that help users understand forex, international money transfers, and travel-related financial services.


